Viewing automation reports #
Automation reports show you how your automations perform. You see which automations are most active, where contacts drop out, and which emails work well. This data helps you improve your automations and tune them to your audience.
Automation reports in Autorespond are based on FluentCRM Pro, included in your package. Read the FluentCRM documentation
Where to find the reports #
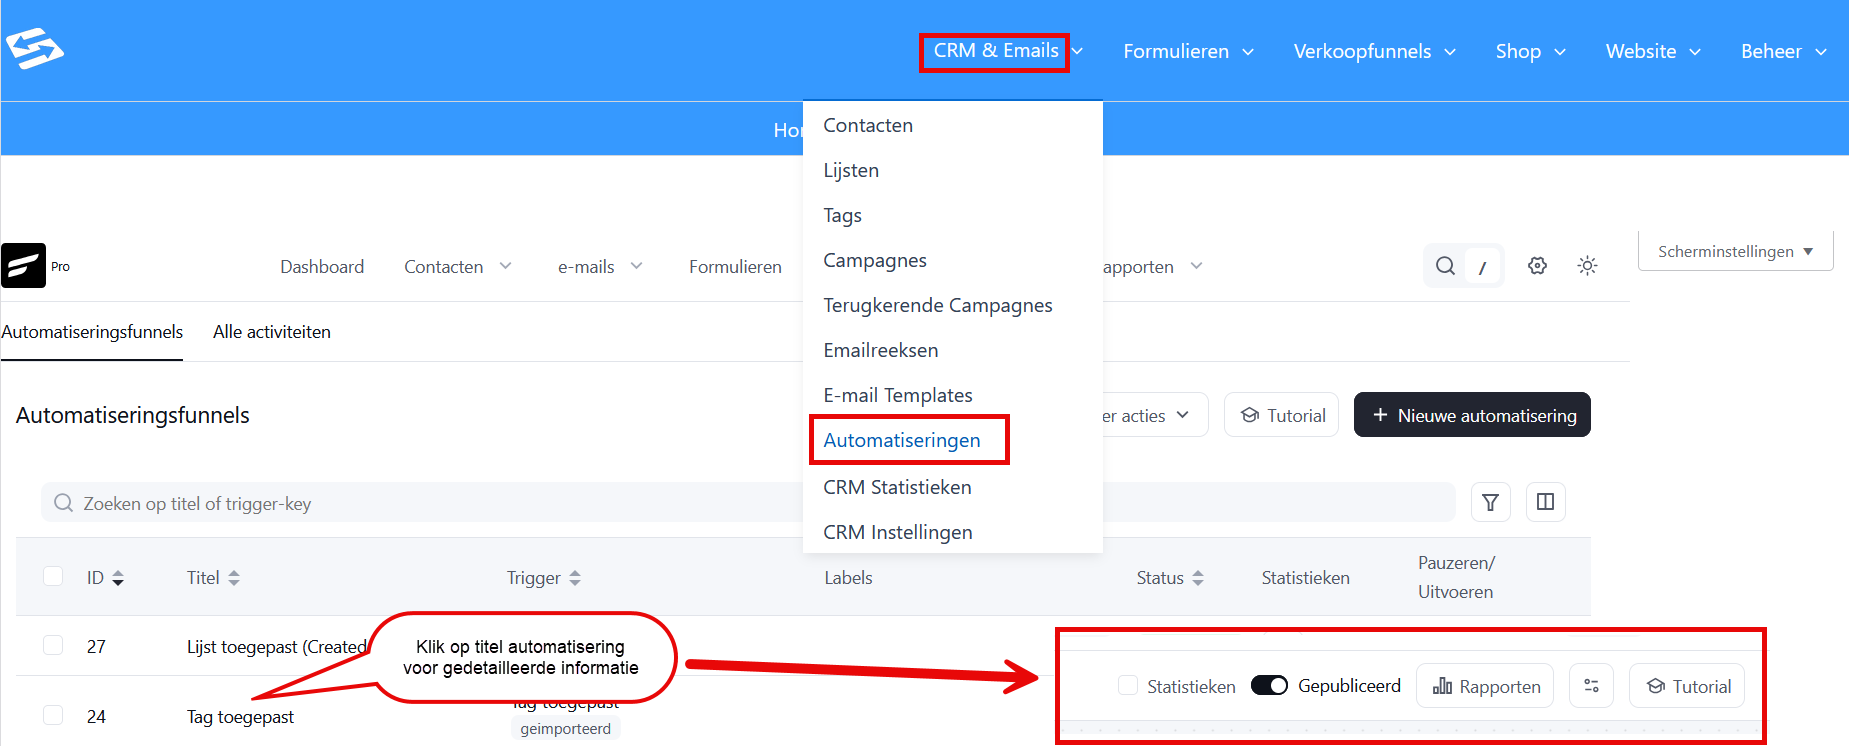
Go to CRM & Emails → Automations. Click the title of an automation to open its details. At the top you see several tabs, including ‘Statistics’.
Overall performance #
For every step you see how many contacts have been there and what the percentage is compared with the previous step. This gives a clear picture of where contacts may drop out of the process. At the top you see the total number of contacts that have started, completed, and are currently active in the automation.
Step-by-step analysis #
The report shows every step in your automation with the matching statistics. For each action you see how many contacts reached that step and what percentage that is of the previous step. This is very useful for spotting where contacts drop out or where emails perform well.
Overview report of all automations #
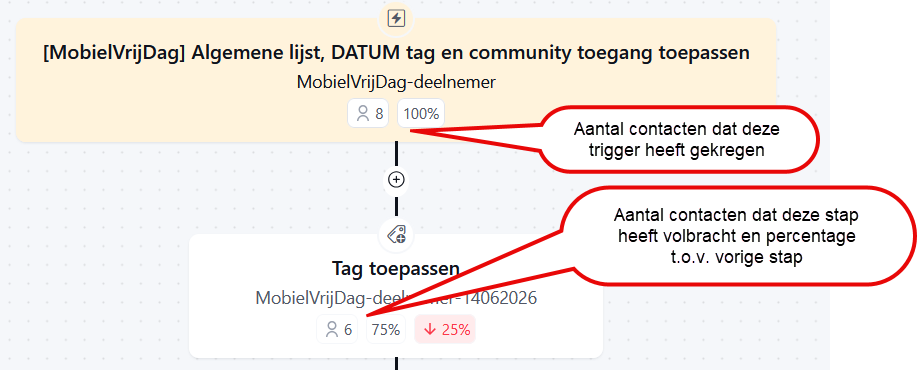
In the main overview under CRM & Emails → Automations you see a summary of the key figures for each automation:
- Status: whether the automation is active or switched off (1)
- Started: number of contacts that have started the automation (2)
- Active: contacts that are currently somewhere in the automation (3)
These figures give you a quick picture of which automations are used most and how effective they are.
Detailed report per automation #
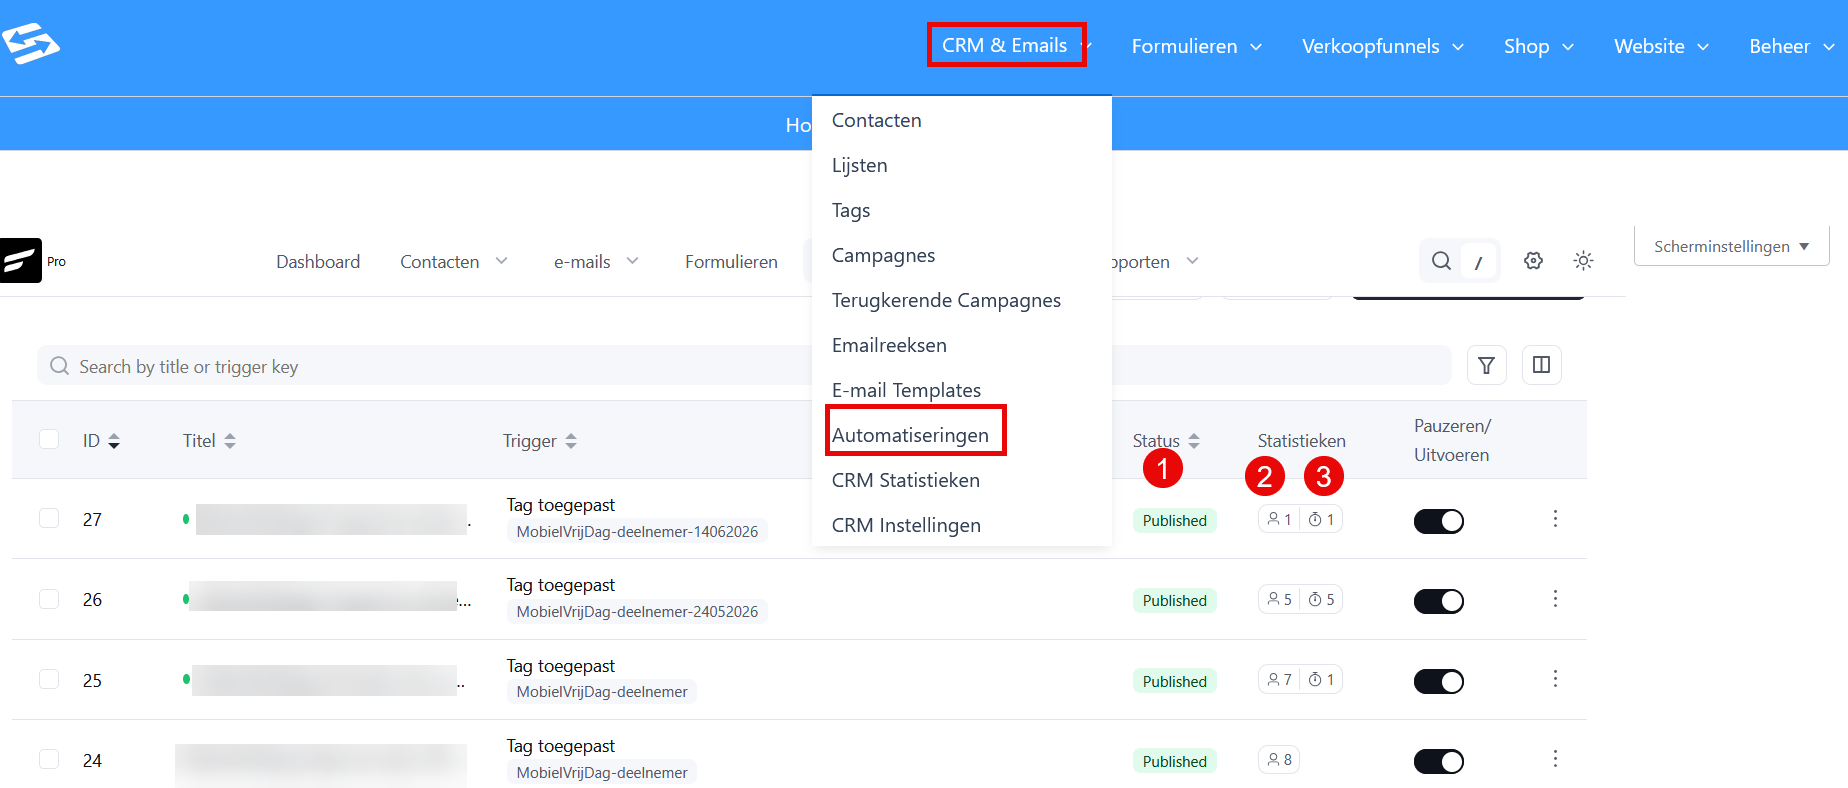
In the main overview under CRM & Emails → Automations, click the person icon (2) below ‘Statistics’ for an automation to open the detailed report. The tabs let you switch between a Chart report, Step report and Email analytics
Email analytics #
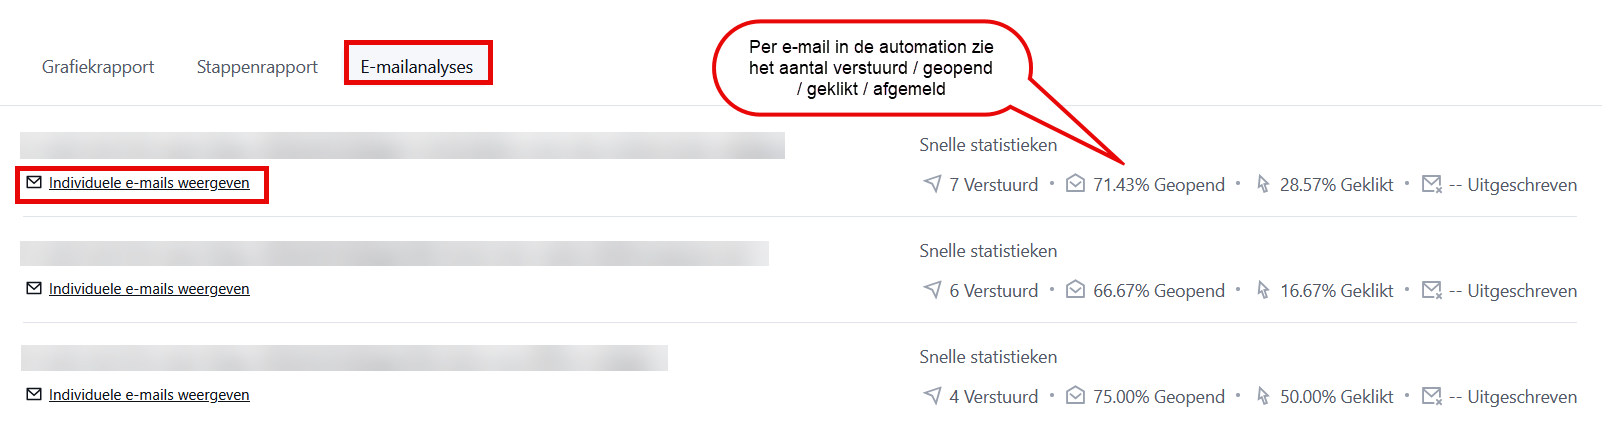
For email actions inside your automation you get specific figures:
- Sent: number of emails that were actually sent
- Opened: number of opens and the open rate
- Clicked: number of clicks on links in the email
- Unsubscribed: contacts that unsubscribed through this email
If you click “Show individual emails” just below a particular email, you see per contact whether they opened the email and/or clicked a link.
Step report #
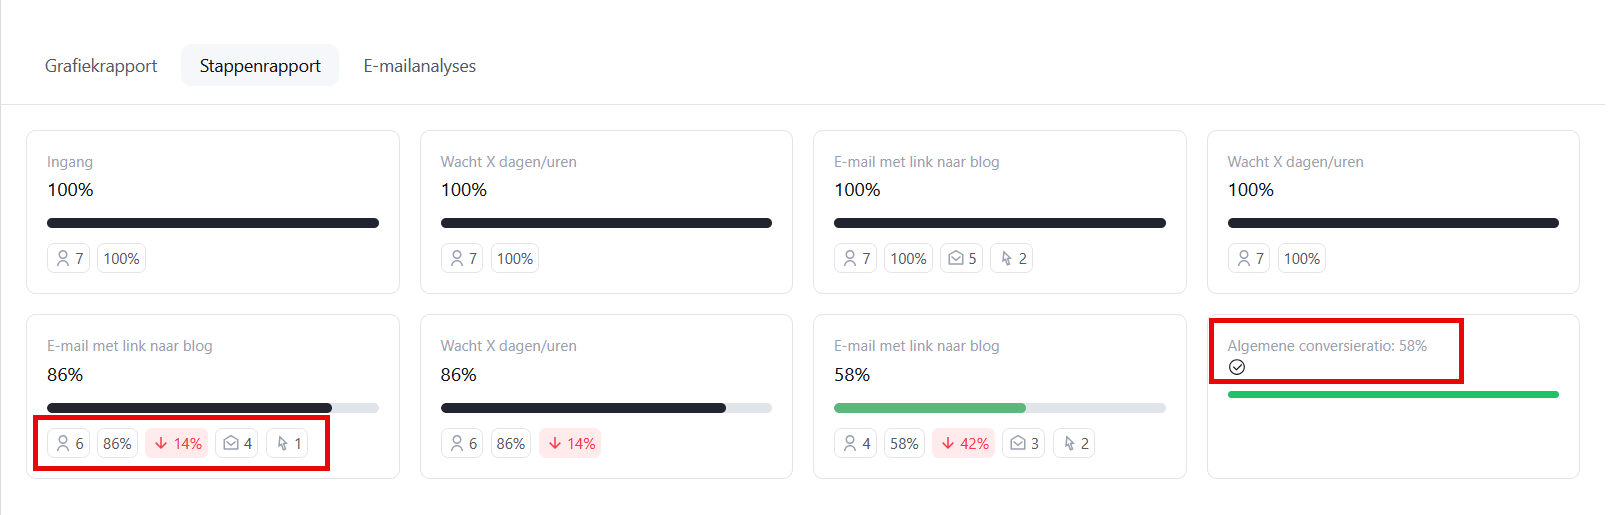
The Step report shows you, for each step of the automation:
- Number of contacts: the number of contacts that went through this step
- Percentage: the percentage of contacts that went through this step compared with the previous step
- Opened: for email steps, the number of opened emails
- Clicked: for email steps, the number of clicks on links in the email
The last block shows the overall conversion rate of this automation, in other words the percentage of contacts that complete the entire automation.
Viewing contacts in an automation #
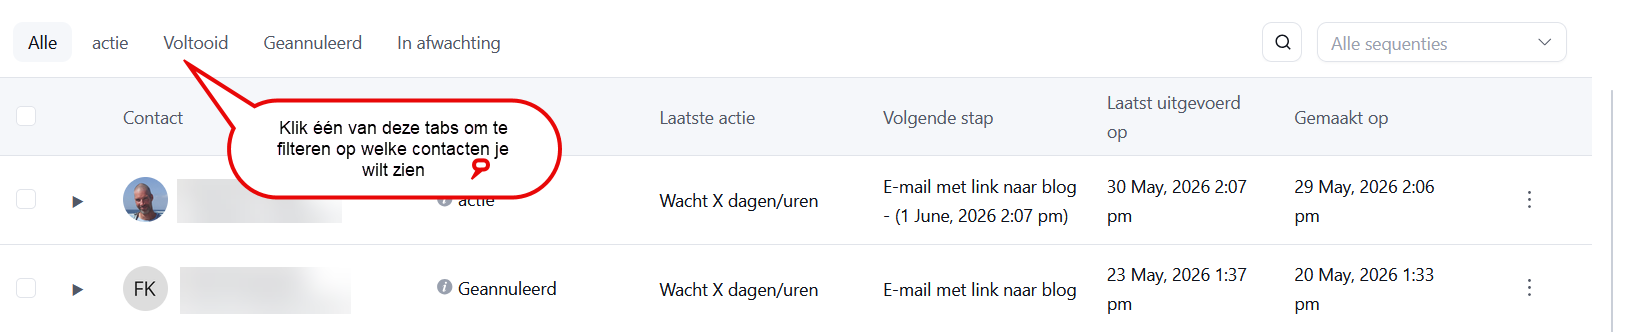
At the bottom of the page you see all contacts that are currently active in the automation or have completed it. You can filter by status (active, completed, stopped) to view specific groups.
For each contact you see:
- Which step they are on
- When they started the automation
- Their progress through the automation
This is handy for following up individual contacts or for identifying problems in your automation.
Interpreting automation performance #
When you analyse your reports, pay attention to these key indicators:
Conversion between steps #
Look at how many contacts move from step A to step B. A large drop-off between two steps can point to a problem in your logic or timing.
Email open rates #
A low open rate can mean that your subject line is not appealing enough or that your emails end up in spam. An open rate of 20-25% is usually good for automated emails.
Click rates #
The click percentage shows how engaging your content is. If people open your emails but do not click, you may need to improve your call to action or your content.
Using reports for optimisation #
The statistics help you improve your automations. If you see that many contacts stop at a particular step, you can adjust that step. Perhaps the waiting time is too long, or the condition is too strict.
You can also use successful automations as a template for new ones. If a particular email series performs well, you can use similar content in other automations.


