If you sell subscriptions in your webshop, you want to know what revenue to expect in the coming months, for your cash flow planning or a revenue forecast. The Upcoming recurring revenue report lets you look up to 12 months ahead: you see how many renewals are scheduled per month and what amount they represent. You export the figures as a CSV file for Excel in one click.
Subscription reports in Autorespond are based on WooCommerce Subscriptions, included in your package. Read the WooCommerce Subscriptions documentation
Step 1: open the subscription reports #
In the menu, go to Shop → Subscription reports.
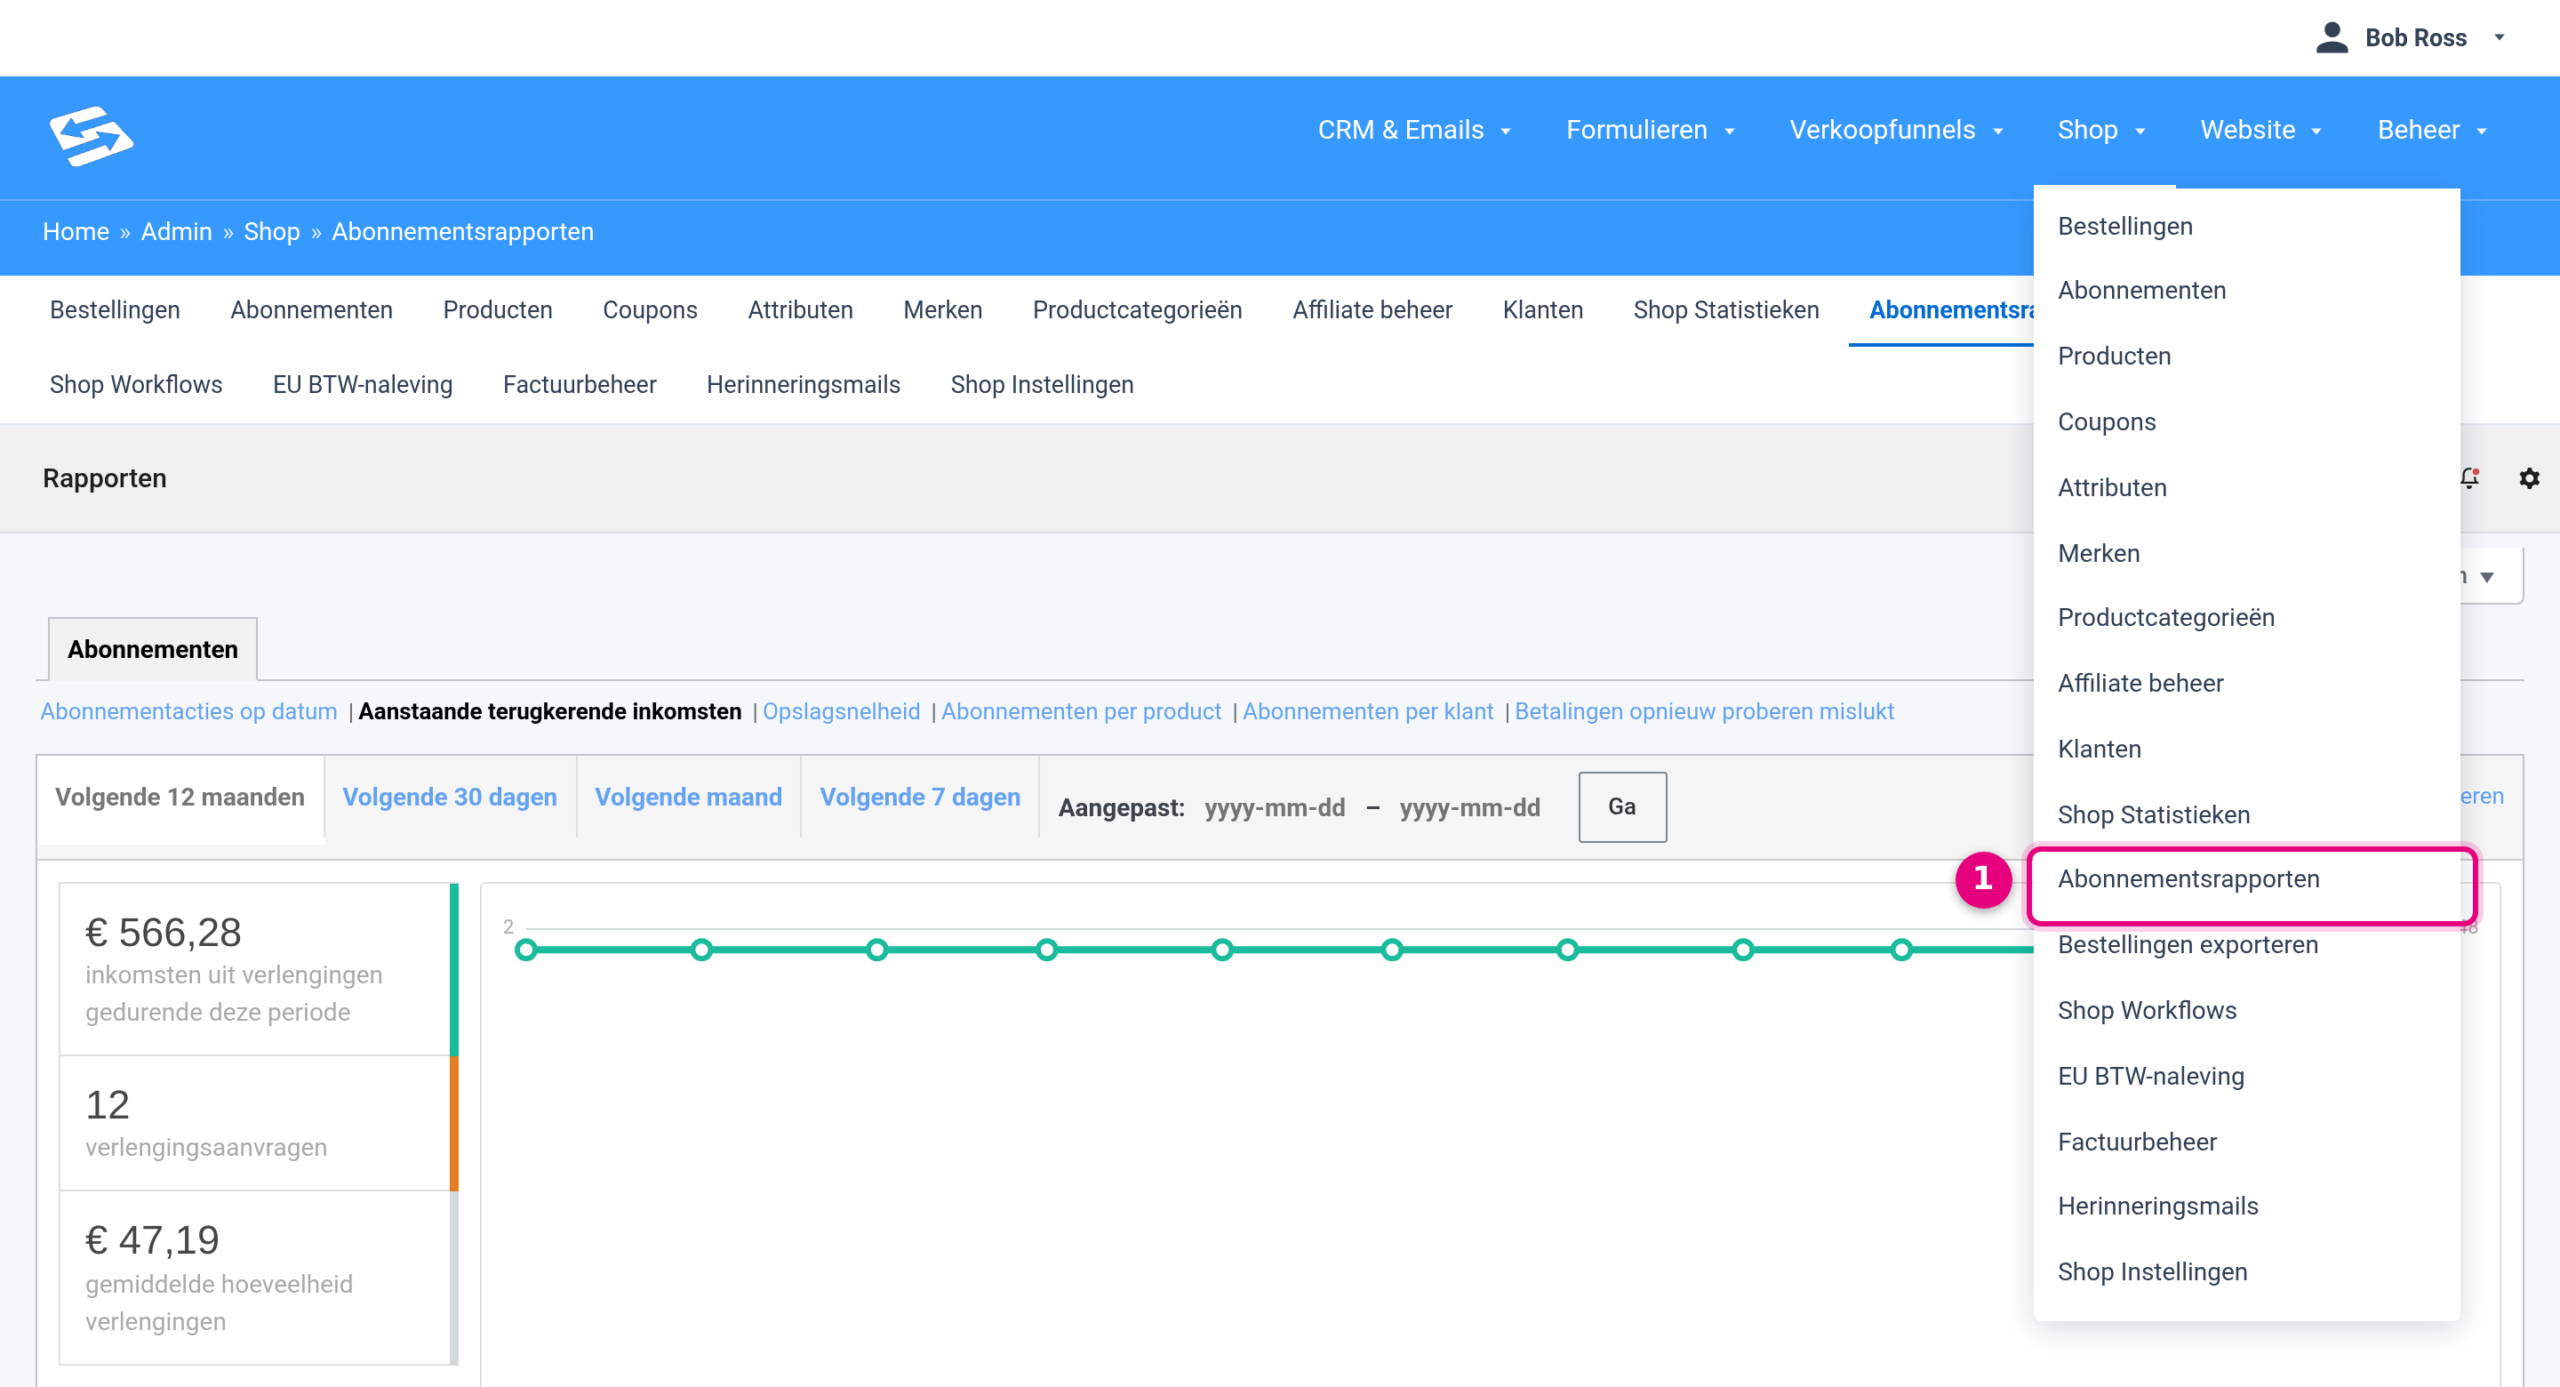
- In the Shop menu, click Subscription reports. The Upcoming recurring revenue report opens straight away. The same items from this menu also appear in the horizontal bar at the top of the Shop pages, so Subscription reports is there too.
Step 2: choose the view and the period #
At the top of the report you choose which view you are looking at and over which period.
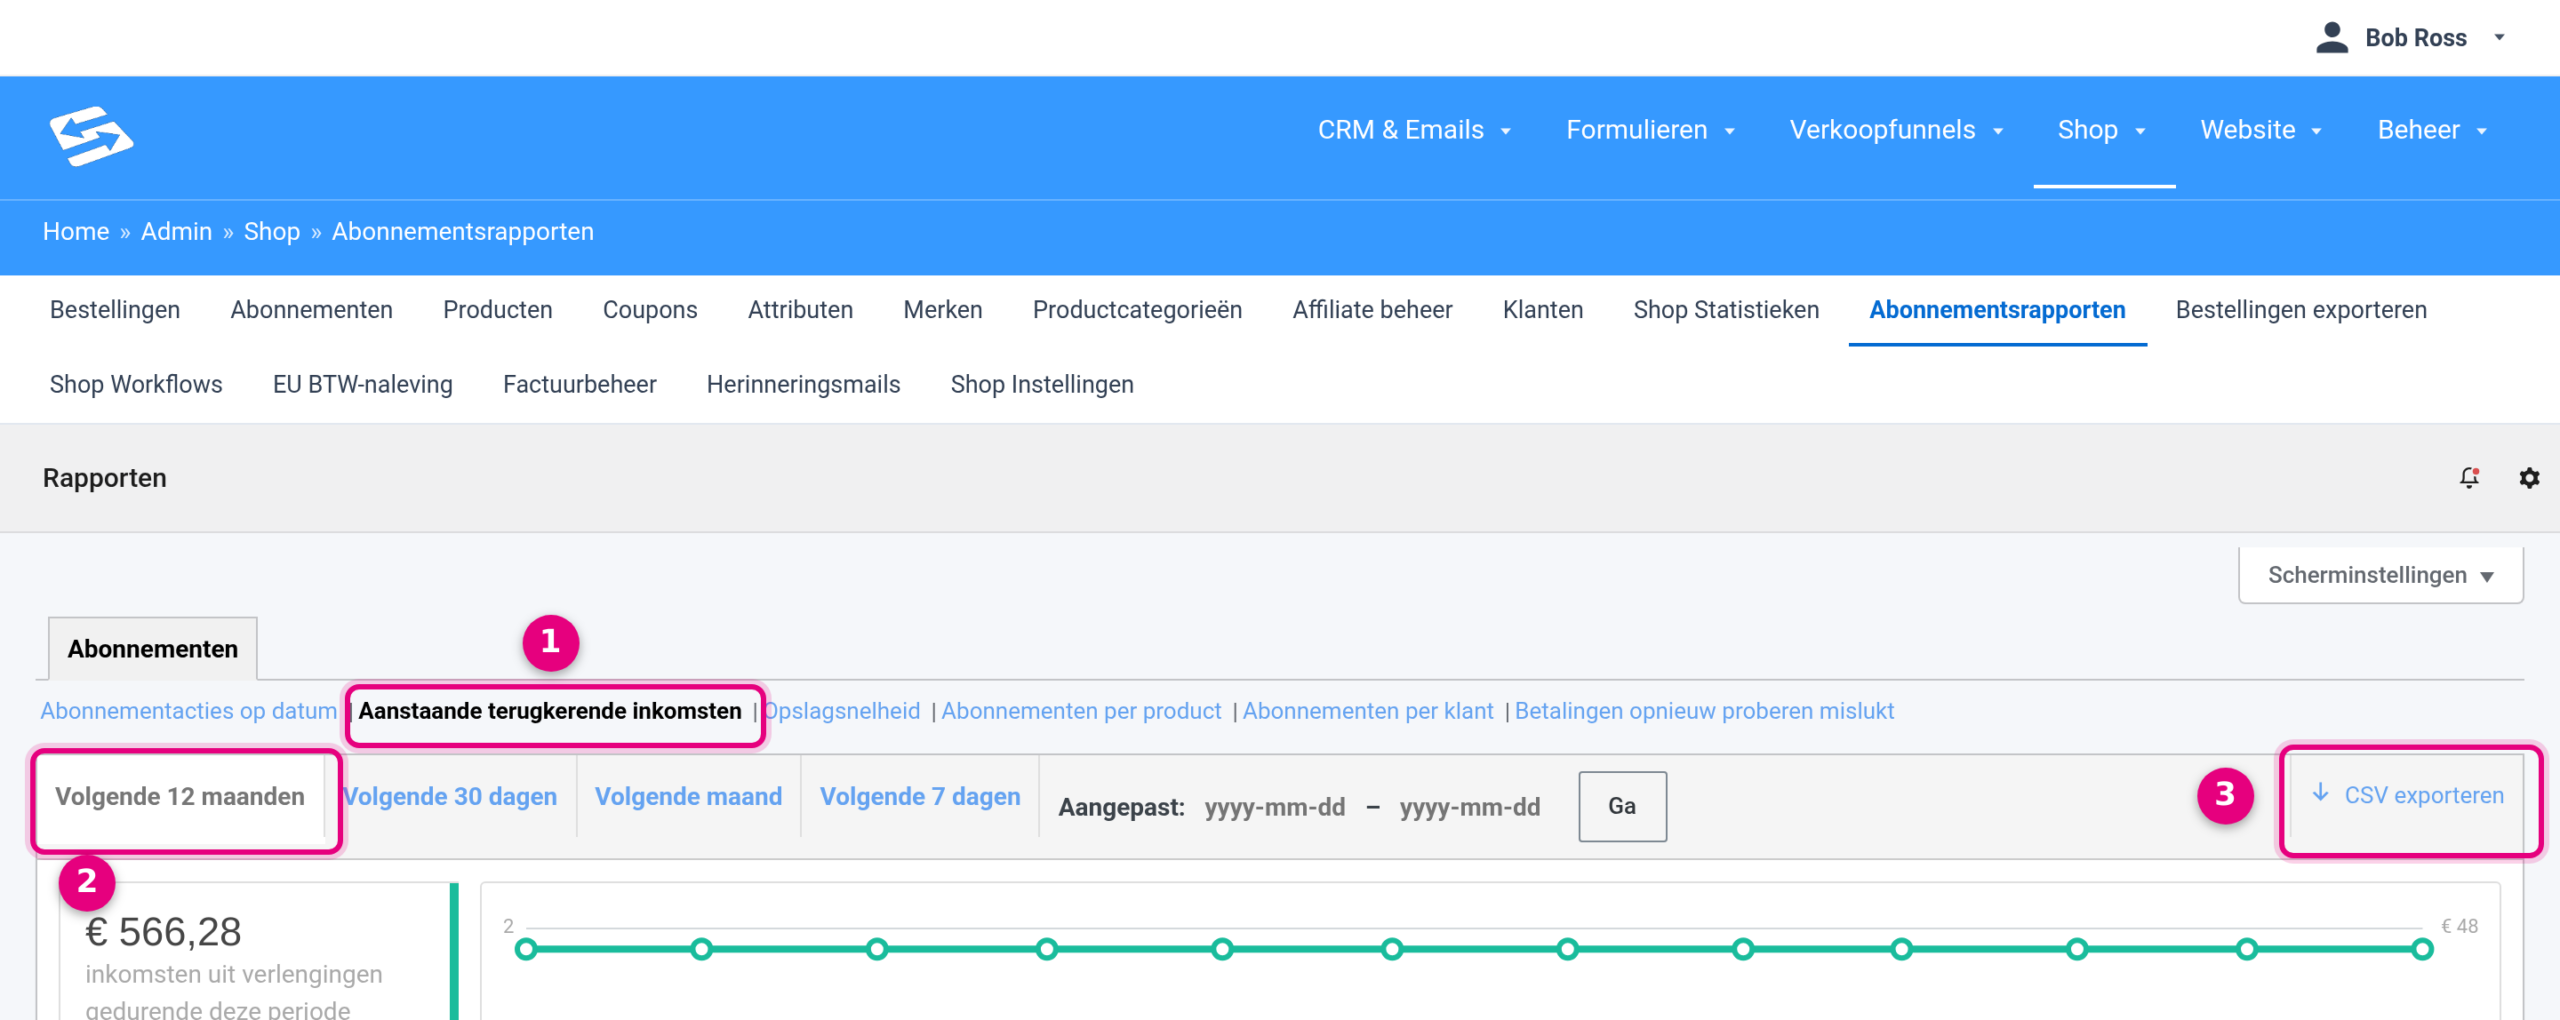
- Upcoming recurring revenue is the view that opens by default: the forecast of your renewal revenue. The other views are on the same line: Subscription events by date, Retention rate, Subscriptions by product, Subscriptions by customer and Failed payment retries. The Subscriptions by product view is useful if you want to see how many subscriptions are running per subscription product, with the average instalment amount and the average lifetime value per product.
- Next 12 months: click this to look a full year ahead. You can also choose Next 30 days, Next month or Next 7 days, or enter your own start and end date under Custom and click Go.
- Export CSV: this downloads the figures of the open report as a CSV file, see step 4.
Step 3: read the forecast #
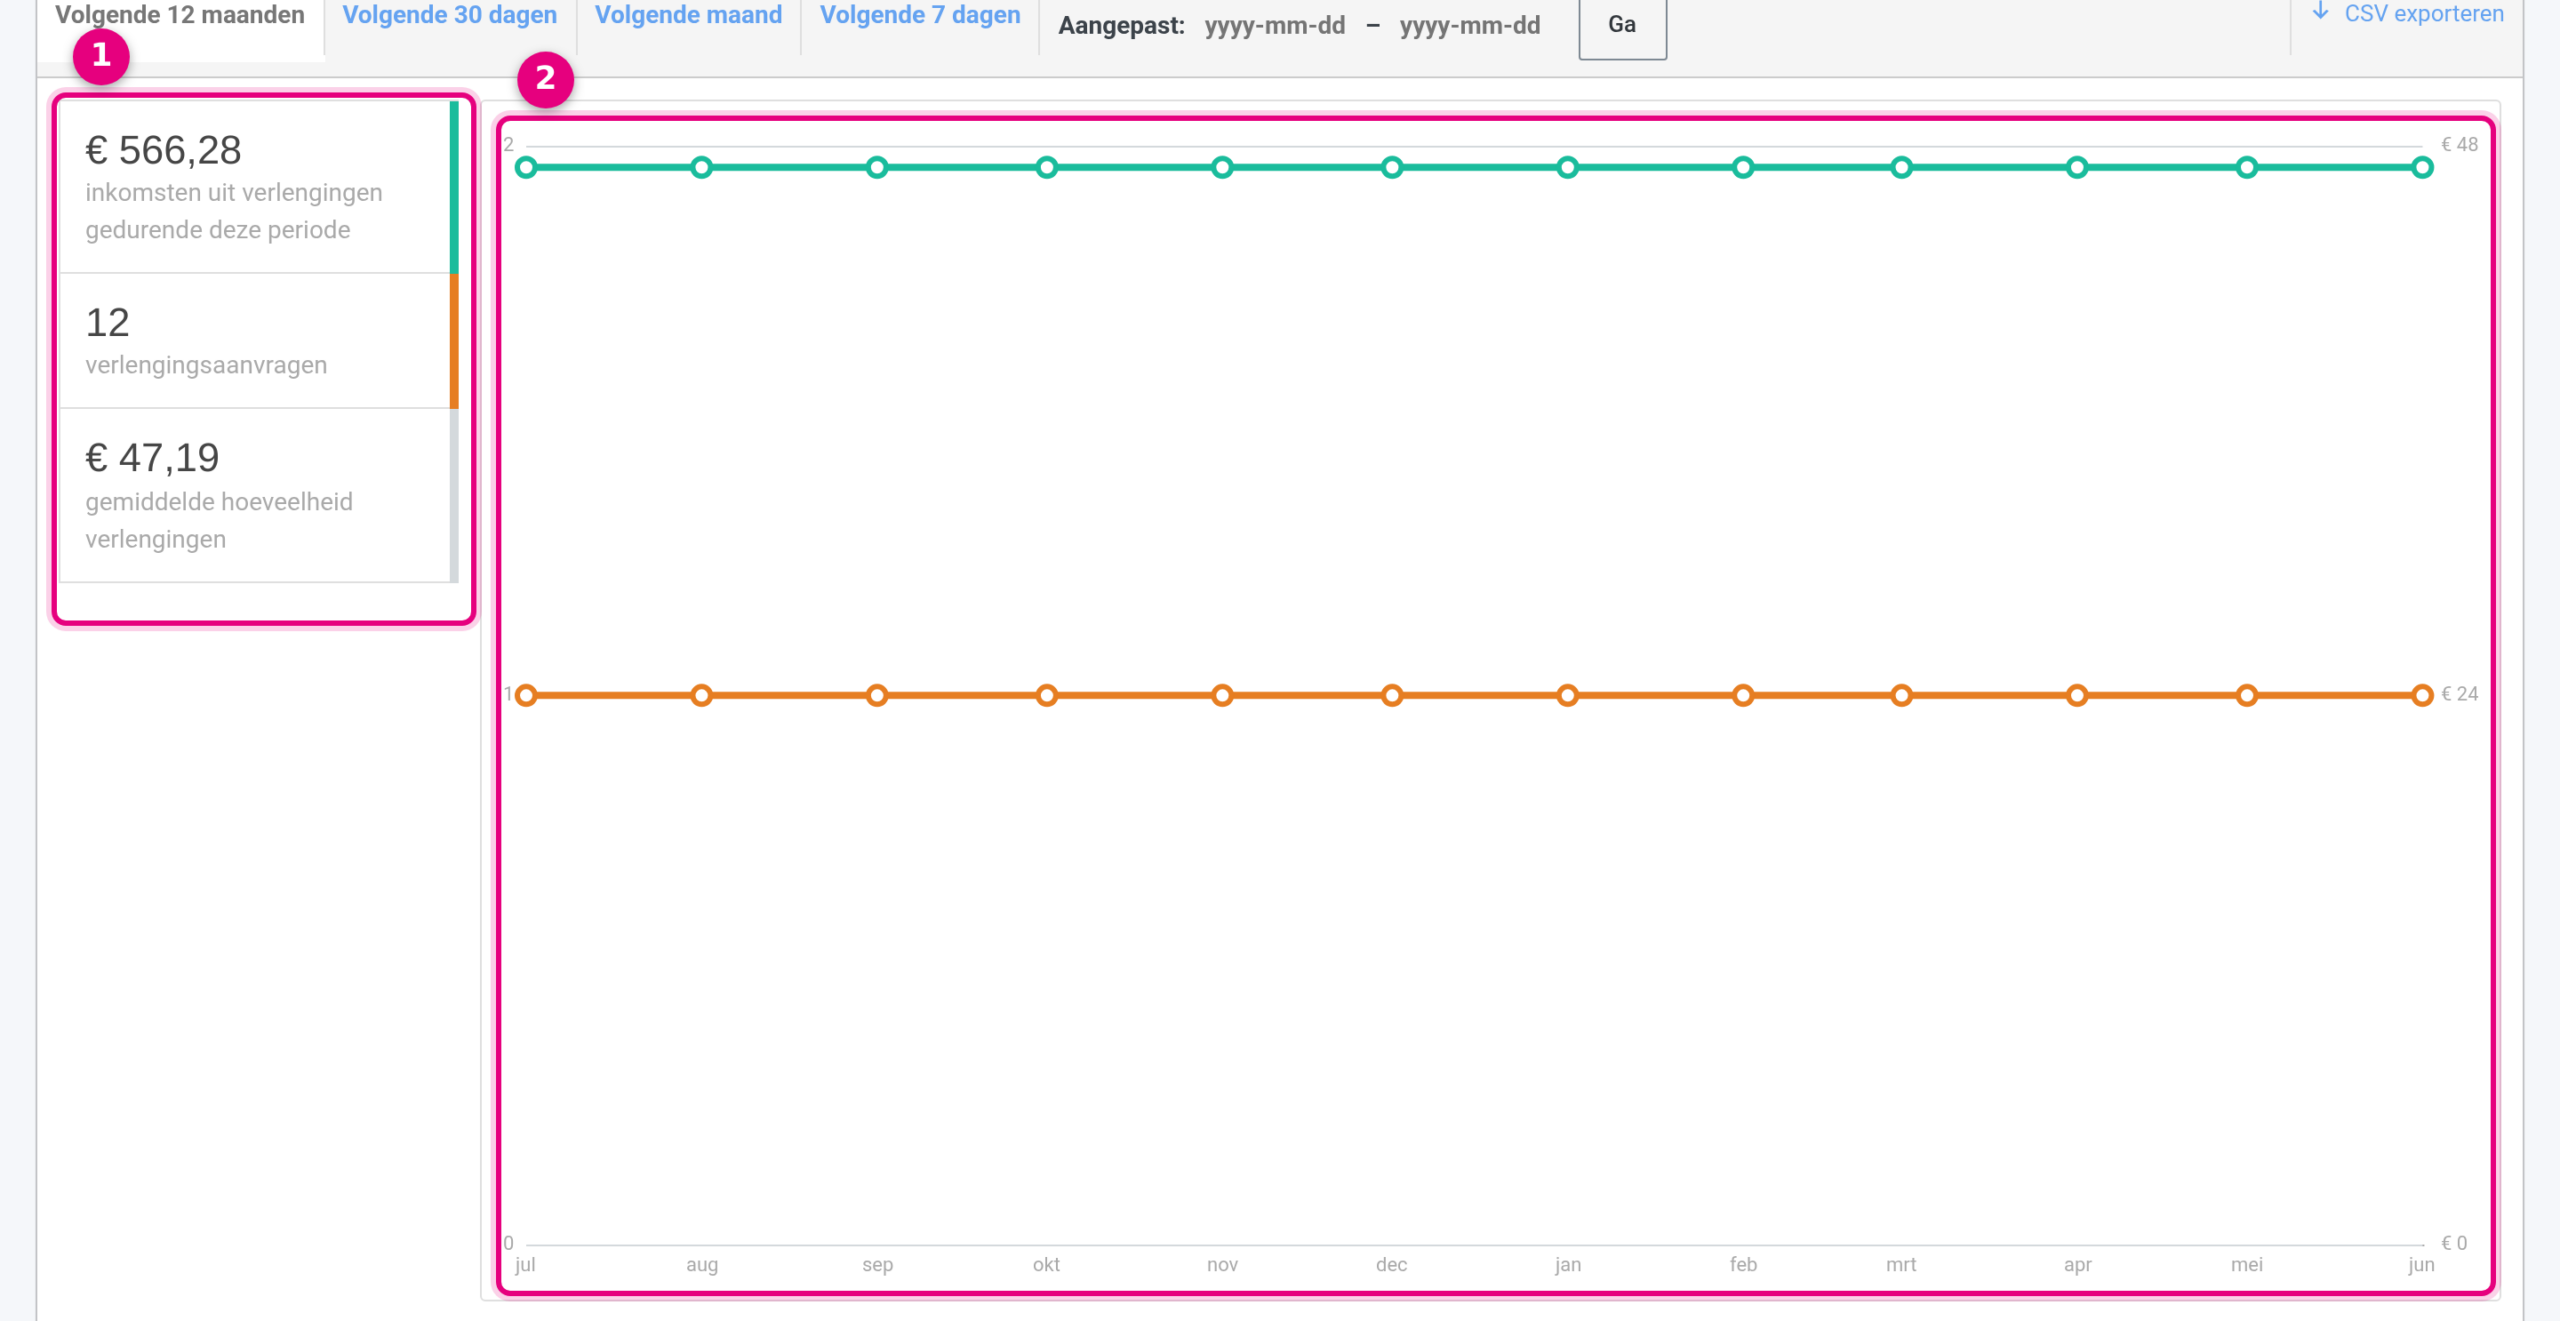
- The totals for the chosen period: the expected amount of revenue from renewals (€566.28 in this example), the number of scheduled renewal requests (12) and the average amount per renewal (€47.19, shown on screen as “average renewal amount”).
- The chart shows the forecast per month: the green line is the expected renewal revenue (right-hand axis, in euros), the orange line the number of renewals (left-hand axis). At the bottom you see the months of the chosen period.
Worth knowing: the forecast chart adds up all subscriptions together. A breakdown per subscription type or per product is not part of this chart. If you do want to look per product, use the Subscriptions by product view from step 2; that shows the current state of your subscriptions, not a forecast. Also bear in mind that the forecast is based on the subscriptions as they stand now: if a customer cancels later, those renewals disappear from the report.
Step 4: export the figures for your own forecasts #
Click Export CSV at the top right of the report. You then download a CSV file with the figures of the view and period that are open at that moment. Open this file in Excel or Google Sheets so you can feed the expected renewal revenue straight into your own forecasts or cash flow planning.


